You can report a pothole in five places and still never hear back.
An open drain outside your gate is everyone's problem and nobody's job. Here's what reporting one usually looks like today.
Ten people reply "same here." Nobody files anything.
Talk, no actionMunicipal corporation, jal board or electricity board? Each has its own channel.
Which department?Ward number, zone and category codes the citizen doesn't know.
Language barrierWorks for people with followers. Most people don't have them.
Unequal voiceNo status, no proof anyone saw it. The citizen stops reporting.
Most civic forms assume English. Most residents think and speak in Hindi or Hinglish.
A reference number with no visible progress feels the same as no reference number.
Fifty people complaining separately about one pothole looks like fifty small problems, not one big one.
Residents can't see whether their area is improving or being ignored compared with the next one.
Who I had in mind
- Context
- Homemaker in Bhopal. Uses WhatsApp and YouTube daily, never a government portal.
- Needs
- Report in Hindi, in under a minute, without knowing which department owns the drain.
Shikayat toh kar doon, par pata kaise chalega ki kisi ne dekha bhi?
- Context
- Runs the residents' association for 300 homes in Noida. Juggles WhatsApp, spreadsheets and ward meetings.
- Needs
- One list of everything pending in the colony, with photos, to take to the councillor.
I need evidence, not forwards.
- Context
- Councillors, local journalists and civic groups who want to know where problems pile up.
- Needs
- A trustworthy, locality-level picture instead of scattered complaints.
Show me which streets need attention first.
Personas are illustrative.
When people report something and nothing visibly changes, they stop reporting. So I made the changes visible.
Give every locality a public scoreboard. When pending, resolved and stuck issues are visible by PIN code, each report becomes part of a collective signal, and residents come back to check on their neighbourhood, not just their own ticket.
What I designed, screen by screen
 1
2
3
4
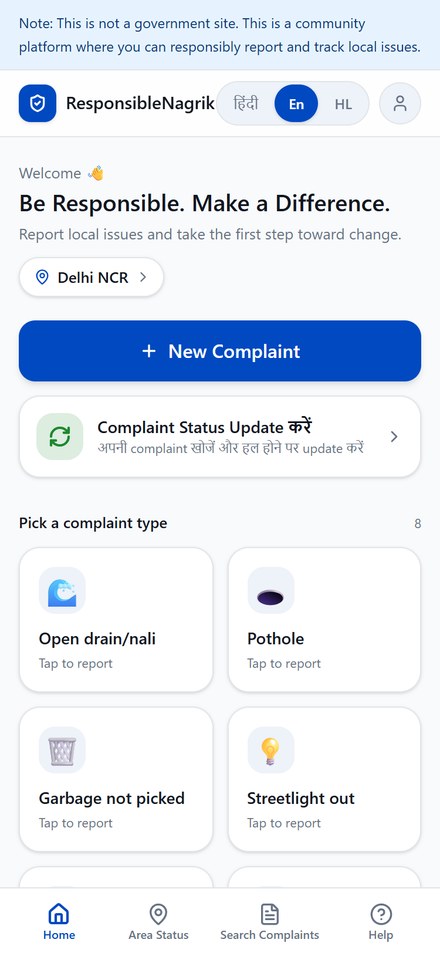
The first thing on every screen says this is not a government site. It would be easy to look official. Being clear about what the product is builds more lasting trust, and keeps it on the right side of impersonation.
Hindi, English or Hinglish is chosen at onboarding before anything else, and can be switched from any screen. Hinglish isn't a translation. It's how most users actually type.
"New Complaint" is the only primary button. Checking on an old complaint is a quieter second card, because new reports are what feed the whole system.
The eight most common problems are shortcuts right on the home screen, in everyday words: Open drain, Pothole, Garbage not picked.
"Garbage not picked," not "Solid waste management." Labels follow the selected language, and in Hinglish mode each type shows both the English term and the everyday word ("Pothole / Gadha").
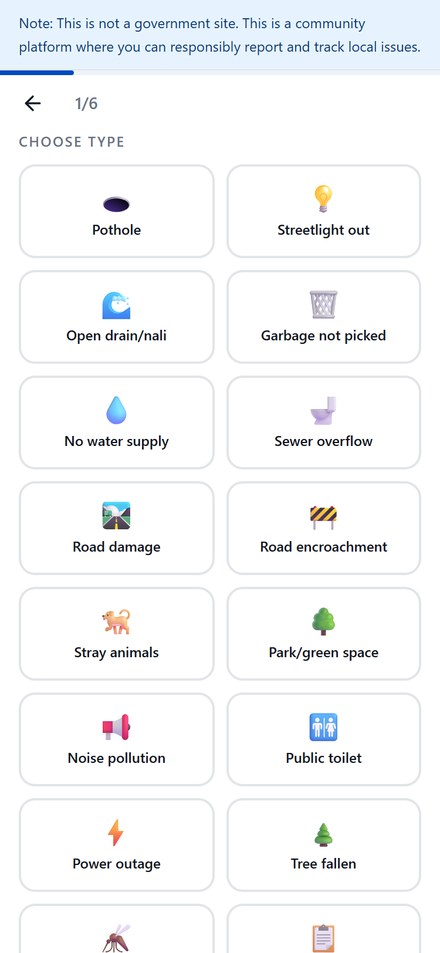
Enough to cover real life, from stray animals to dengue mosquitoes, while keeping the data structured enough to compare localities. "Other issue" catches the rest.
The photo step asks for three specific shots: a wide shot, a close-up and a landmark. A field worker can find the problem and judge how bad it is. Photos are optional, so a missing camera never kills a report.
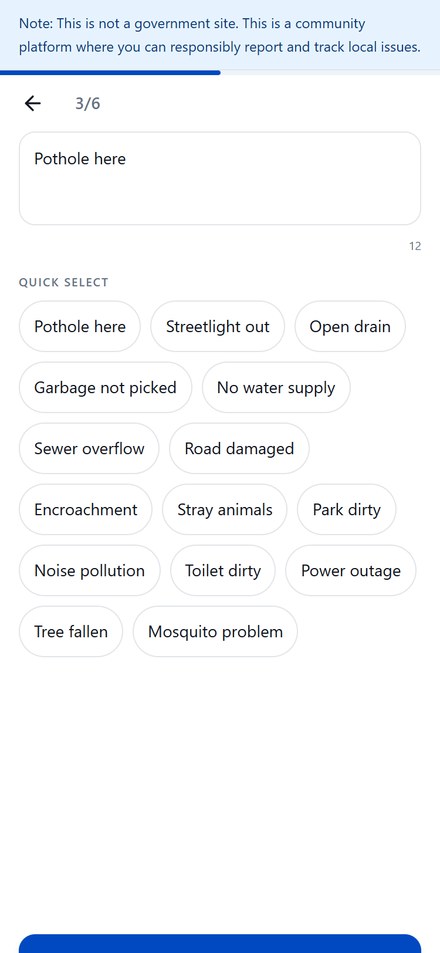
"Quick select" chips fill in the description with one tap. Typing on a phone keyboard is where most forms lose people.
 5
6
Same screen, three languages
This is how the app's issue picker behaves. People pick a language at onboarding and can switch from any screen.
Reporting takes about a minute
I gave each step a time budget. If a step can't fit its budget, it gets cut or made optional.
My favourite part: seeing your whole area
English recreation of the live screen, using its real data. The app shows this page in Hindi only for now.
Every locality gets a live status card, refreshed every four hours and searchable by PIN code or city. It answers the question residents actually have: is anyone fixing things here?
How big the backlog is right now.
Shows momentum, so improvement is visible early.
Resolved as a share of everything reported.
Ageing issues, which carry the most frustration.
Comparison, designed carefully. Areas can be compared three ways:
I chose "needs attention" over "worst areas," and gave "good work" equal billing. The goal is to motivate whoever can fix things, not shame a neighbourhood.
How AI fits in, now and next
How AI built it
- I built it end to end with Lovable, an AI app builder.
- I wrote product requirements as prompts, checked every generated screen against the personas, and kept iterating until each flow felt right.
- Owning the build meant every trade-off was mine to make, which is the part I enjoyed most.
AI roadmap (not built yet)
What I'm measuring
These are targets for the first 90 days, not results.
Problems a resident marks as fixed. It only grows if people report, come back, and things actually get done.
- Pilot localities 25 / week
- Start-to-submit completion > 70%
- Median time to report < 60s
- Reports with photos > 60%
- Reports with precise location > 85%
- Reporters returning to check status, D7 > 40%
- Spam or fake report rate < 3%
- Duplicate reports per issue tracked
- False "resolved" updates < 5%
- Photos with faces or plates blurred
- Status data freshness ≤ 4h
Trade-offs I made
| Decision | What I gave up | Why it was worth it |
|---|---|---|
| Independent community platform, not a government channel | Direct routing to officials on day one | Launch without permission, earn trust through transparency, and integrate with civic bodies once there's data worth sharing. |
| Photos optional | Evidence on every report | A report without a photo beats no report. Guided shots raise quality for people who do add them. |
| Fixed categories instead of free text | Some nuance in what people describe | Structured data makes locality comparison possible, which is the core of the product. |
| "Needs attention" instead of "worst" | A punchier, more viral ranking | Shame creates defensiveness in the people who can fix things. Recognition creates competition. |
| Citizens confirm resolution | Authoritative, verified closure | No official API exists. The person who reported it is the best judge of whether it's actually fixed. |
Every colony already has a WhatsApp group. That's where this spreads.
Every RWA already has a group where complaints get discussed and forgotten. Responsible Nagrik gives that group a place to put them and a card to share back.
Prove the loop
- Pilot with a few RWAs in cities that already have reports
- Shareable status card for WhatsApp
- Reliable location search and clean seed data
Make AI do the work
- Photo-to-category and duplicate merging
- Hinglish voice reporting
- RWA admin view and weekly digest
Close the loop officially
- Partner with municipal bodies for routing
- Ward-level scorecards before local elections
- Open data for journalists and researchers
What I learned
The form gets people in. Seeing their area's status is what brings them back.
Supporting Hinglish touched the copy, the categories and the default flow. It was much more than a translation file.
A half-translated screen breaks trust fast. Area Status still shows Hindi in English mode, and it's first on my fix list.